Background
Though I am not specialized in network, I had to draw network diagram time to time in different circumstances. Everytime I looked for suitable option of drawing tool, and this time I tried Graphviz for the first time.
My challenge this time is that physical location of network devices have to be shared to non-IT people. The drawing doesn't have to be scale accurate, but should depict physical nature to some degree. For example, whether a network hub is placed on floor or over ceiling has to be instantly understood.
PowerPoint use
At first, I picked a readily available tool, PowerPoint.
Placing rectangle boxes and connecting them with zigzag lines worked for a while.
But I gave up to update it when I extended that network to another floor. That change required me to shift all existing objects and every line in the diagram to make room for that another floor, and PowerPoint elobow line function is quite tough to achieve that.
So, I looked for alternatives.
Looking for alternatives
I usually use diagrams.net (formerly draw.io) for software diagrams, but it doesn't have connecting point on boxes enough for LAN diagrams.
Reddit or StackOverflow discussions about network diagraming tools often cite LucidChart, but it turned out not having enough connecting points either.
Most network people seem to like Visio, but it has some downsides from my perspective.
- Have to acquire license. License fee for myself can be justified, but how about those fee for every IT team member and some other related personnels.
- Auto routing of connection is sometimes too intelligent to the degree annoying.
I also looked for Visio clones, such as Edraw Max. But this also has the same limitation to share works.
So, I have decided to try Graphviz this time.
What I got
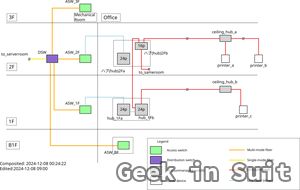
My finished diagram is like below (labels are anonymised) after some manual post-processing with Inkscape.
The DOT file and other companion files can be found on GitHub. Note that layout engine is fixed to neato, which supports pos attribute.
https://github.com/takyanagida/graphviz-network-diagram
Now it takes only one make command after modifying the DOT to get a diagram like above. I'm very satisfied.
My workflow
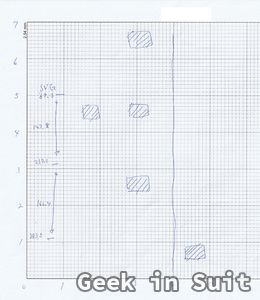
- Drawing rough sketch on inch graph paper. (I used graph paper PDF found https://takebo.wpxblog.jp/gridpaper/ ) Note that this sketch is not the first draft but only for reading node positions. Before reaching this sketch, I drew many more during actual network investigations.
- Manually create DOT file (I use
.gvas file name extention to distinguish it from Word Template file) on Emacs with graphviz-dot-mode. Node positions are read from graph paper and adjusted multiple times with previewing. (OnlyC-c C-cin graphviz-dot-mode) Edge routings are first automatic, and then adjusted by adding some waypoints manually. This process may take a few hours, but will be good investment. - When layout becomes almost satisfying, execute
make(it is essentiallyneato -Tsvg) to get SVG output. - Open that SVG with Inkscape and add background (grouping and some lines) and legend layer. Draw those layers manually, and save to a file. Then edit that SVG with text editor, and remove graph layer to have
background.svgfile. Doing this way enables updatingbackground.svgwith Inkscape. - Write small Python script using
minidomto do automatic composition of Graphviz output SVG, background.svg, and some other post-processing (label translation, and raisingtextelements to seperate layer out of node group to make later manual SVG editing easy. - Write
Makefileto automate the process.
Notes on my workflow
Cluster functionality of Graphviz neato (and fdp) could be used. I tried it very briefly and shifted to manual way.
I chose minidom over xml.etree.ElementTree against Python documents recommendation below.
Users who are not already proficient with the DOM should consider using the xml.etree.ElementTree module for their XML processing instead.
https://docs.python.org/3/library/xml.dom.minidom.html
The reason behind my decision is minidom keeps SVG comments, which is automatically added by Graphviz.

