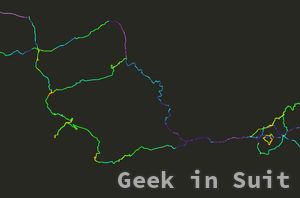
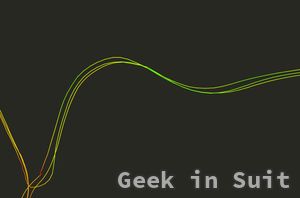
After spending weeks playing with my own 2-year GPS log, I wanted to colorize each track gradiently based on velocity.
While it sounds straight-forward to use the "trackpoints" table in the same SpatiaLite database to achieve this, it turned out not so. Plotting millions of points is quite slow and also I prefer lines over points.
Then, I found series of articles on QGIS spatio-temporal data analysis by Anita Graser1. Basic concept is adding timestamp as M-value of each vertex of tracks (called "trajectory" in Anita's articles.) I would call this data structure "timestamp as M-value".
M-value is an additional dimension to common XYZ dimensions and standardized in OGC's Simple Feature Access, probably better known as WKT (well known text.) 2 SpatiaLite does support it, of course.
Anita's articles are based on PostGIS, but I managed to do the same on SpatiaLite. Followings are some details.
Adding M-value to Geometry
Though SpatiaLite has XB_MLineFromGPX() function supporting XYZM coordinate in its document3, it's not implemented in 4.3.0, the latest stable release.4
Since newer 5.0 is still in beta phase, I kept using 4.3.0 and modified gpx2spatialite slightly to add M-value. Below is the diff.
Timestamp in M-value should be a single number (not YYYY-MM-DD string.) I chose unix time (seconds since 1970-01-01) for better resolution. Julian day is another option for SpatiaLite to encode datetime into a single number, but it's too big to handle seconds precision (1 second is smaller than 0.0001 in Julian day.)
Loading M-value'd Track to QGIS
QGIS 2.18 doesn't support Z/M value in SpatiaLite layer provider, but 3.0 or after does.5 So, I updated to newest 3.4.4.
Velocity Coloring of Tracks
After that, I could colorize each track based on velocity following Anita's article. I changed color ramp to "spectrum" of cpt-city just for my preference (red for slow segment, blue for fast segment.)
When you view wide area or crowded area, rendering all tracks may take a few minutes, though QGIS can react to user inputs even while rendering.
Though it seems like points, you can see it really is lines if zoomed in.
Geometry generator's code is almost identical to Anita's. Below is my version. I chose EPSG:102010 for metric distance calculation in the US.
ramp_color(
    'spectrum',
    scale_linear(
        length(
            transform(
                geometry_n($geometry,@geometry_part_num),
                'EPSG:4326','EPSG:102010'
            )
        ) / (
            m(end_point(  geometry_n($geometry,@geometry_part_num))) -
            m(start_point(geometry_n($geometry,@geometry_part_num)))
        )  * 3.6,
        0,120,
        0,1
    )
)
- For a list of articles, visit https://anitagraser.com/movement-data-in-gis/. ↩
- Specification available at https://www.opengeospatial.org/standards/sfa ↩
- https://www.gaia-gis.it/fossil/libspatialite/wiki?name=GPX+tracks ↩
- See commit log for detail https://www.gaia-gis.it/fossil/libspatialite/info/10c77399beb2f25e ↩
- See changelog https://qgis.org/en/site/forusers/visualchangelog30/index.html#feature-support-for-z-m-geometries-in-gpkg-spatialite-and-memory-layer-provider ↩


